
From operational data to a purpose-built energy workflow
·
3 minutes
One data model. One set of rules. Different interfaces for different jobs.
Industrial software often presents users with a choice: adapt the work process to the software, or build a separate application for every specialised task.
With Mikon Server X, we are taking a different approach.
We recently built an energy planning workflow that demonstrates how operational data, external market data, calculations and business rules can first be configured and tested in Mikon Studio, and then exposed through a purpose-built user interface designed for one specific job.
The result is a practical example of what we mean by a headless industrial data platform.
Bringing energy data together
The workflow supports daily power nominations. Instead of entering 24 individual hourly values, the user can work with blocks, copy nominations between days and adjust the plan before the daily deadline.
At 11:00, the nomination is automatically locked. Changes and submissions are recorded with user and timestamp.
But the interesting part is what happens behind the interface.
Mikon Server X automatically collects data from four external sources:
Nord Pool spot prices
StormGeo price forecasts
Norges Bank exchange rates
eSett regulating power prices
These integrations run as scheduled scripts within the platform. No changes to the Mikon product itself were required.
The scripts also monitor themselves. Each job writes a heartbeat, allowing the dashboard to show whether the different data sources are updating as expected.
Business logic you can actually see
The calculations and rules are configured in Mikon rather than hidden in spreadsheets or separate applications.
In this example, the platform calculates energy cost including contracted power and determines which energy source (electricity or LNG) is economically preferable based on the applicable price and threshold.
It can also look back when actual market prices become available and identify the hours where the optimal decision would have changed.
The important point is not the particular energy rule. It is that the operational logic is explicit, inspectable and connected directly to the underlying data.
Access is controlled by roles: a limited number of users can modify the configuration, while a broader group can view the resulting information.
Mikon Studio first
Mikon Studio acts as the engineering environment.
Signals, equations, scripts and dashboards are configured and tested there. This gives engineers and domain experts a transparent environment for developing and validating the workflow before deciding how it should be presented to the end user.
In our energy example, the complete workflow can therefore be operated directly from Studio.
But that does not necessarily make Mikon Studio the ideal interface for everyone.
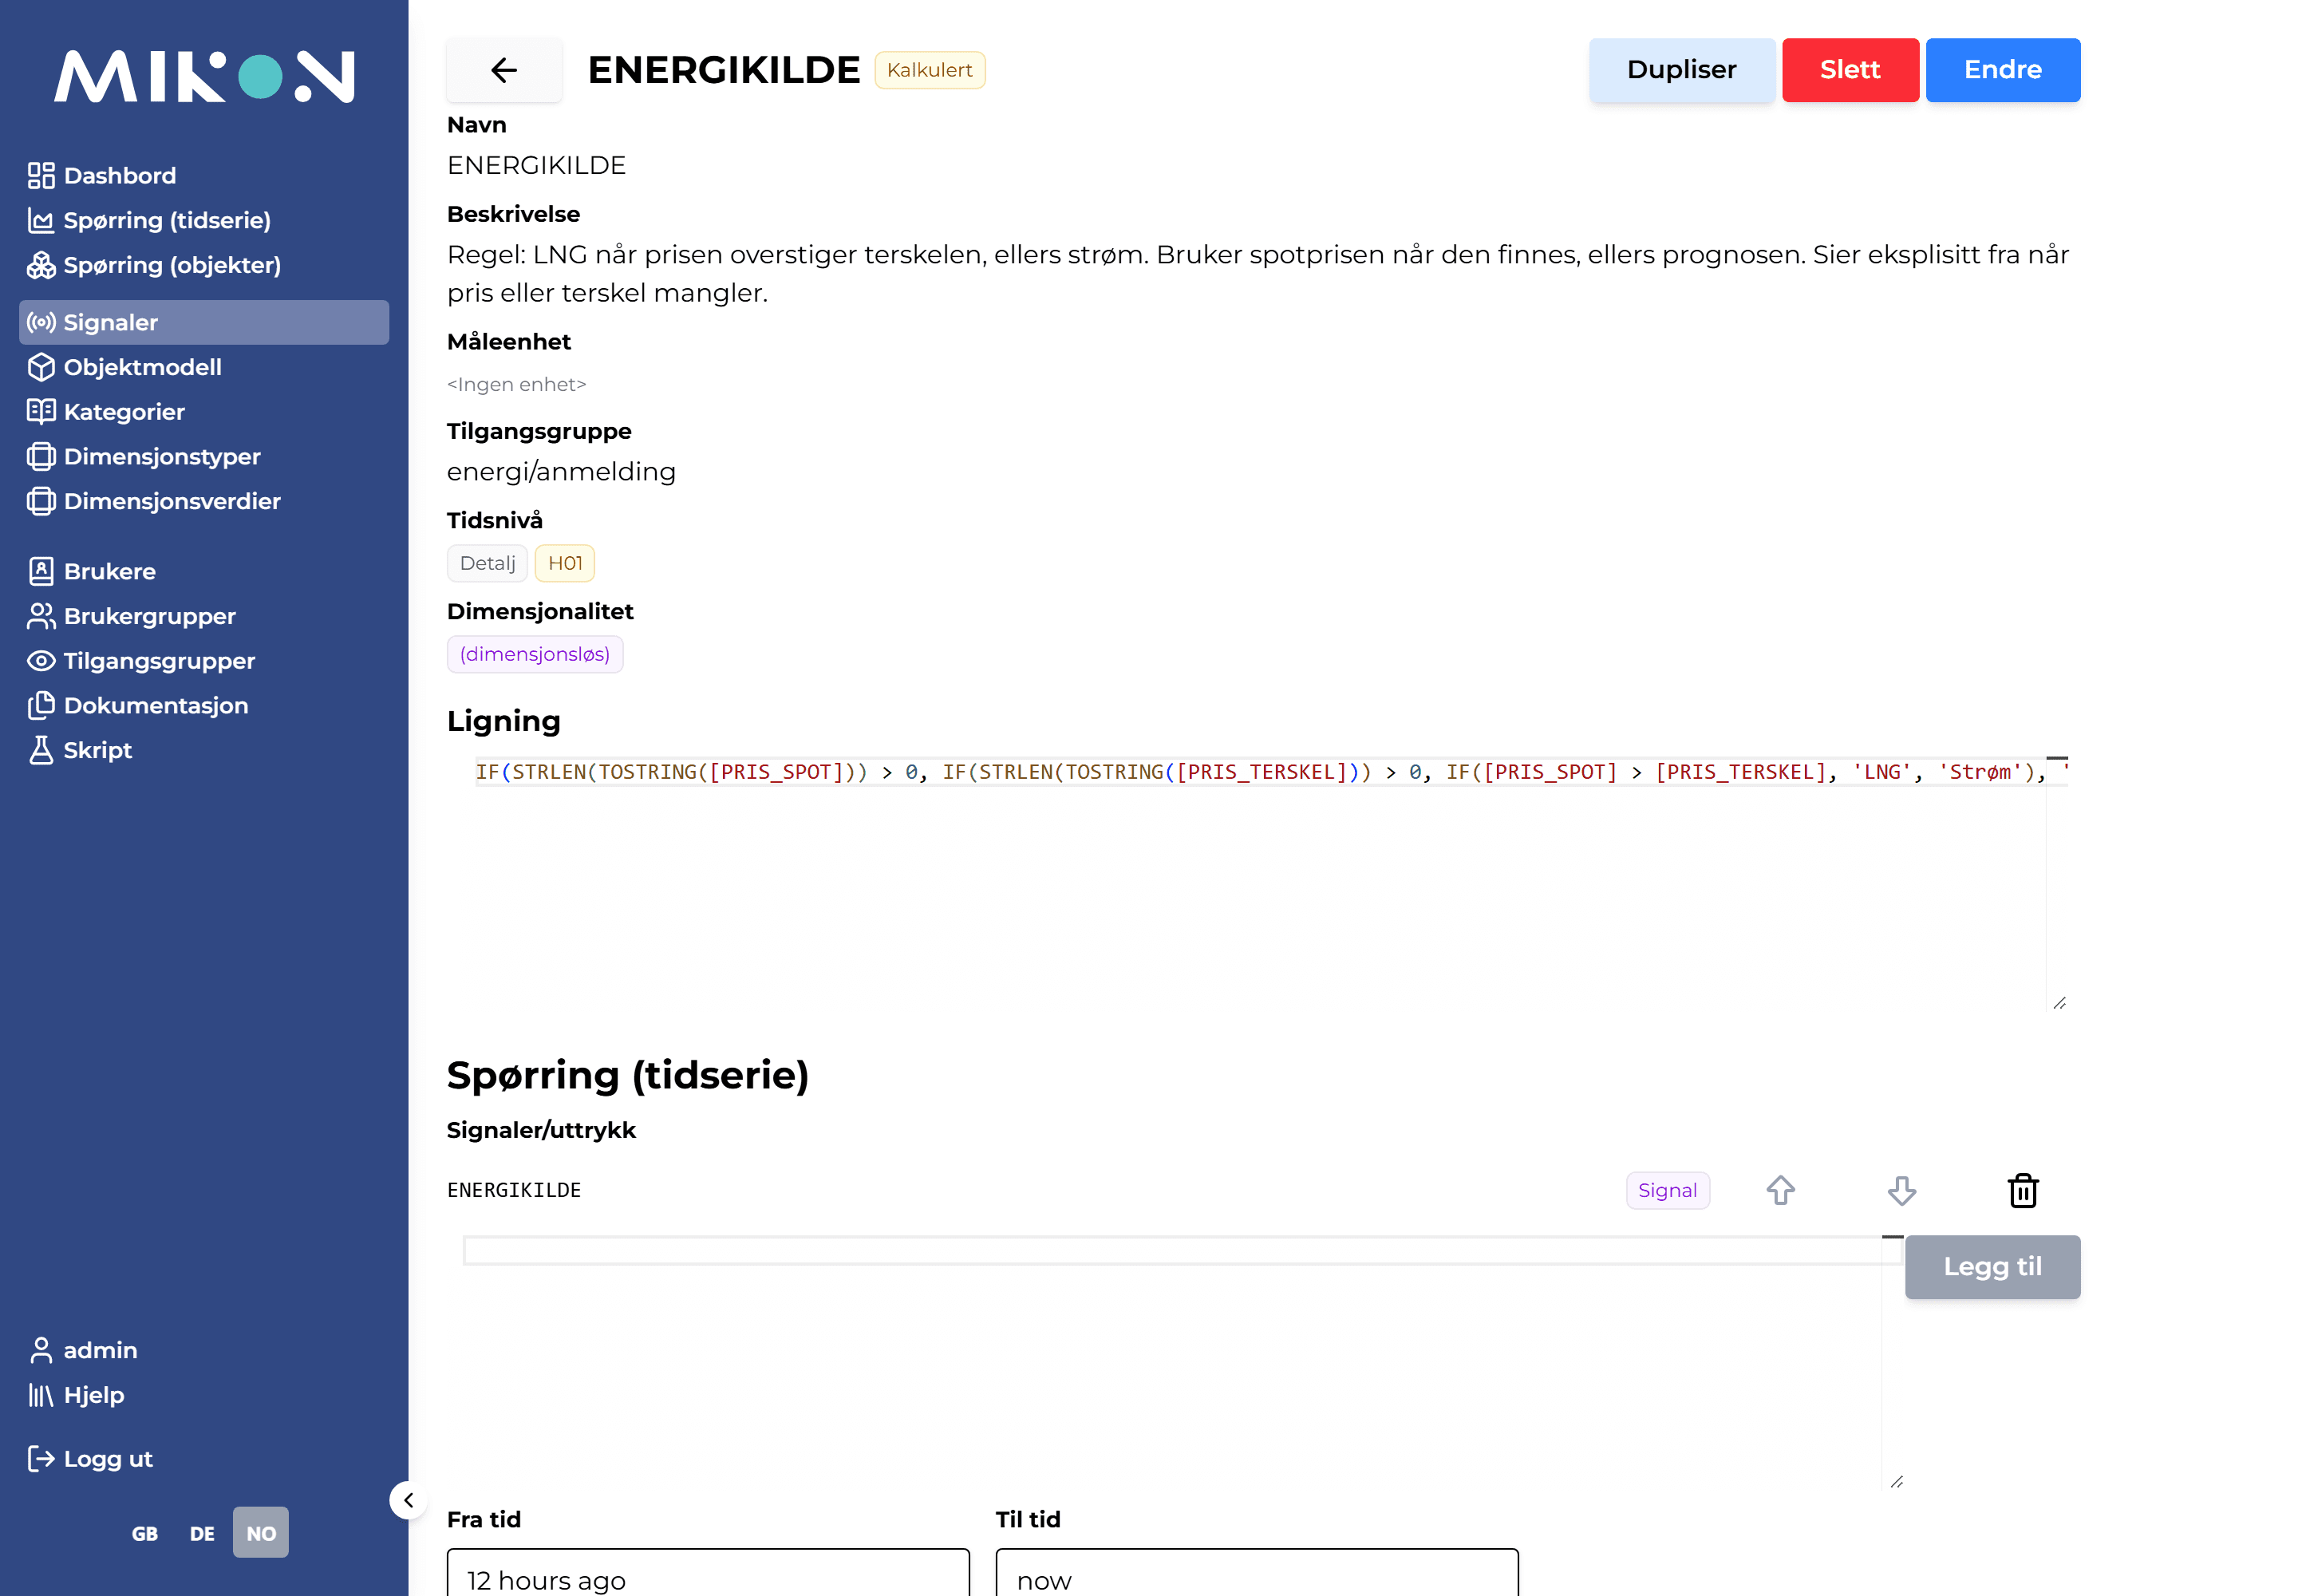
Same data. A different interface.
Once the workflow was established, we created a dedicated HTML interface for energy planning.
The difference is visible immediately.
Instead of navigating a general-purpose industrial data platform, the user gets a screen designed around one task: select the day, adjust the blocks, see how the changes affect energy cost and save the nomination.
The interface is different. The underlying system is not.
The HTML application runs on the same installation, uses the same authentication and accesses the same data through the Mikon API.
When the user presses Save, the request goes through the same script and the same business rules used from Mikon Studio.
One data model. One rule engine. Multiple user experiences.


Headless in practice
This is an important principle behind Mikon Server X.
Industrial users have very different needs. An engineer investigating a process may want the flexibility of Mikon Studio. An operator may need a simple production cockpit. A planner may need an application dedicated to a single daily workflow. Management may primarily need KPIs and exceptions.
There is little reason why all of them should be forced into the same user interface.
By separating the trusted operational data and business logic from the presentation layer, we can create interfaces around the work that needs to be done without creating new data silos or duplicating the underlying logic.
From reporting to operational decisions
The energy example also illustrates a broader development in industrial data systems.
Reporting tells us what happened.
Operational analytics helps us understand what is happening and why.
Combining operational data with forecasts, market data and explicit business rules allows the system to support decisions about what to do next.
That does not require a black-box AI model. In many cases, the first step towards better decision support is much more pragmatic: trusted data, transparent rules and an interface designed around the decision.
And once that foundation is in place, prediction and AI can be added where they genuinely improve the decision.
The energy workflow has been running automatically for a long time and has been validated through 83 controls with no deviations.
For us, that is a useful demonstration of where Mikon Server X is heading:
Trusted operational data underneath. Flexible applications on top.
Good data. Better decisions. Together.